


Most teams have goals. However, very few team members actually see them.
Why? Because those goals are usually buried in strategy documents or tracked separately by team leads. But when you make targets visible—when your team sees them every day, not just in a quarterly report—things start to shift.
SmartSuite dashboards help you bring your goals, progress, and performance tracking front and center into the workspace where work actually happens.
Why Visibility Matters
Hey there—I’m Alex Noles from AutomationHelpers.com. We help companies like yours get set up and automated using the best tools, apps, and integrations.
Whether you’re leading a team or working solo, one of the most powerful things you can do is make performance visible.
And no, this isn’t about micromanagement. It’s about clarity—clarity around your goals, expectations, and progress. That way, everyone knows what they’re working toward.
In this walkthrough, I’ll show you how you can use SmartSuite to bring your team’s metrics front and center.
Step-by-Step: Making Goals Visible in SmartSuite
We’ll use a marketing solution as our example.
Inside the solution, we have multiple tables. The most important one? Marketing KPIs. Here, we’re tracking key metrics like:
- Website traffic
- Leads
- Sales
- Bounce rate
Each KPI includes:
- Starting metric (beginning of the year)
- Goal for the quarter
- Current status
- Forecast for the end of Q2 (June 30, 2025)
- Linked initiatives (aka marketing campaigns)
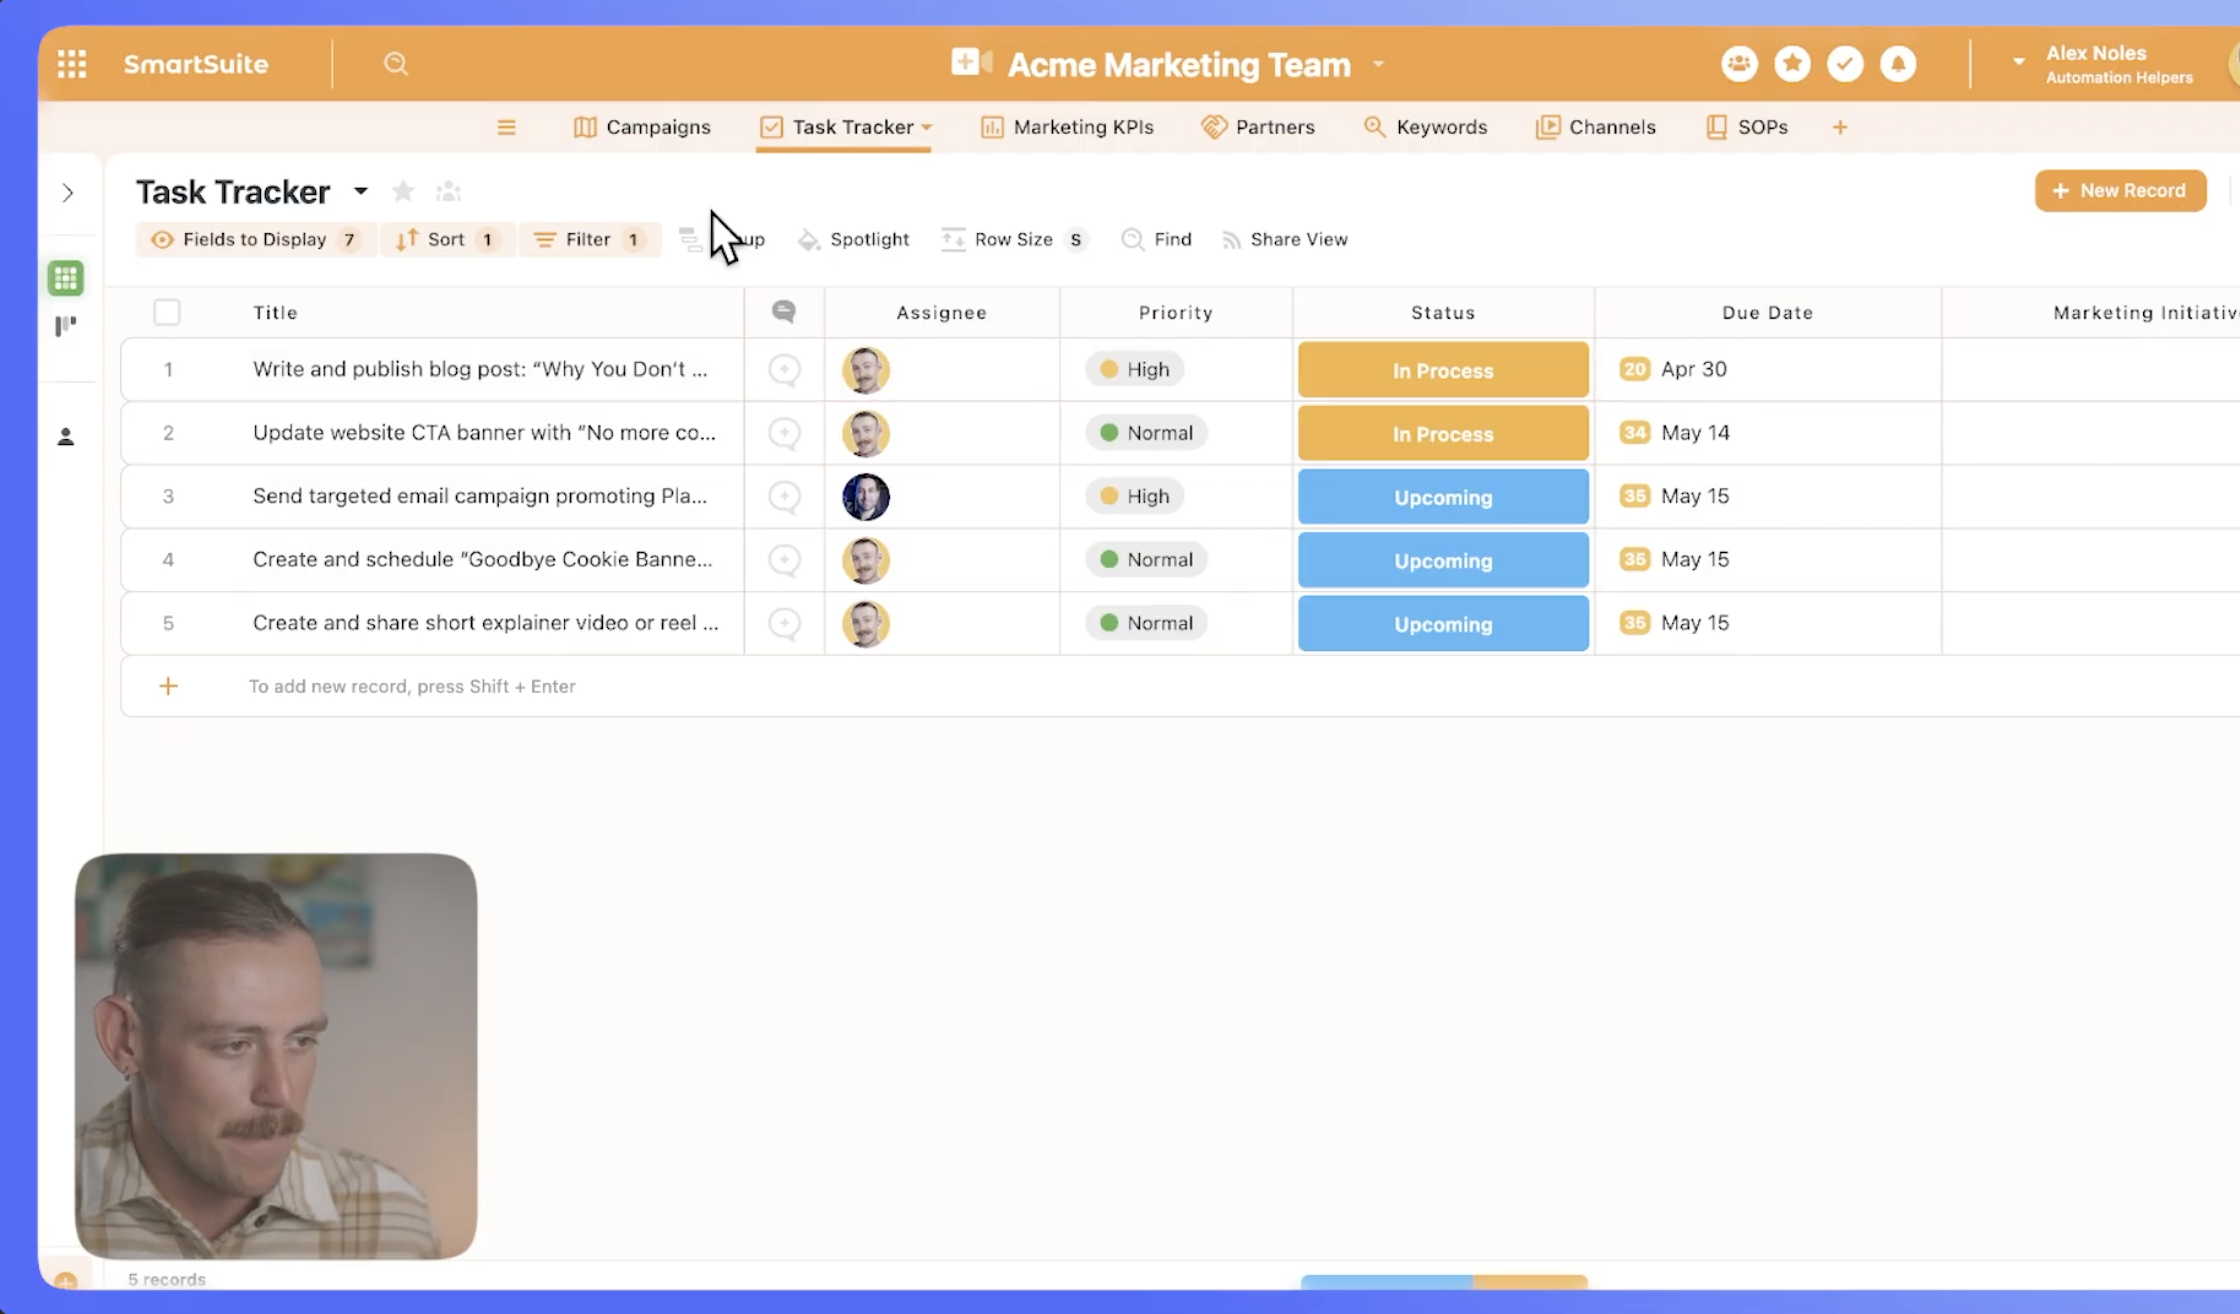
Simple Task Tracker Integration
We also have a Task Tracker with a few sample tasks. These tasks are linked to the marketing campaigns.
So what’s the plan? We want to create a dashboard where our team can complete their work and see how they’re performing.
Building the Dashboard
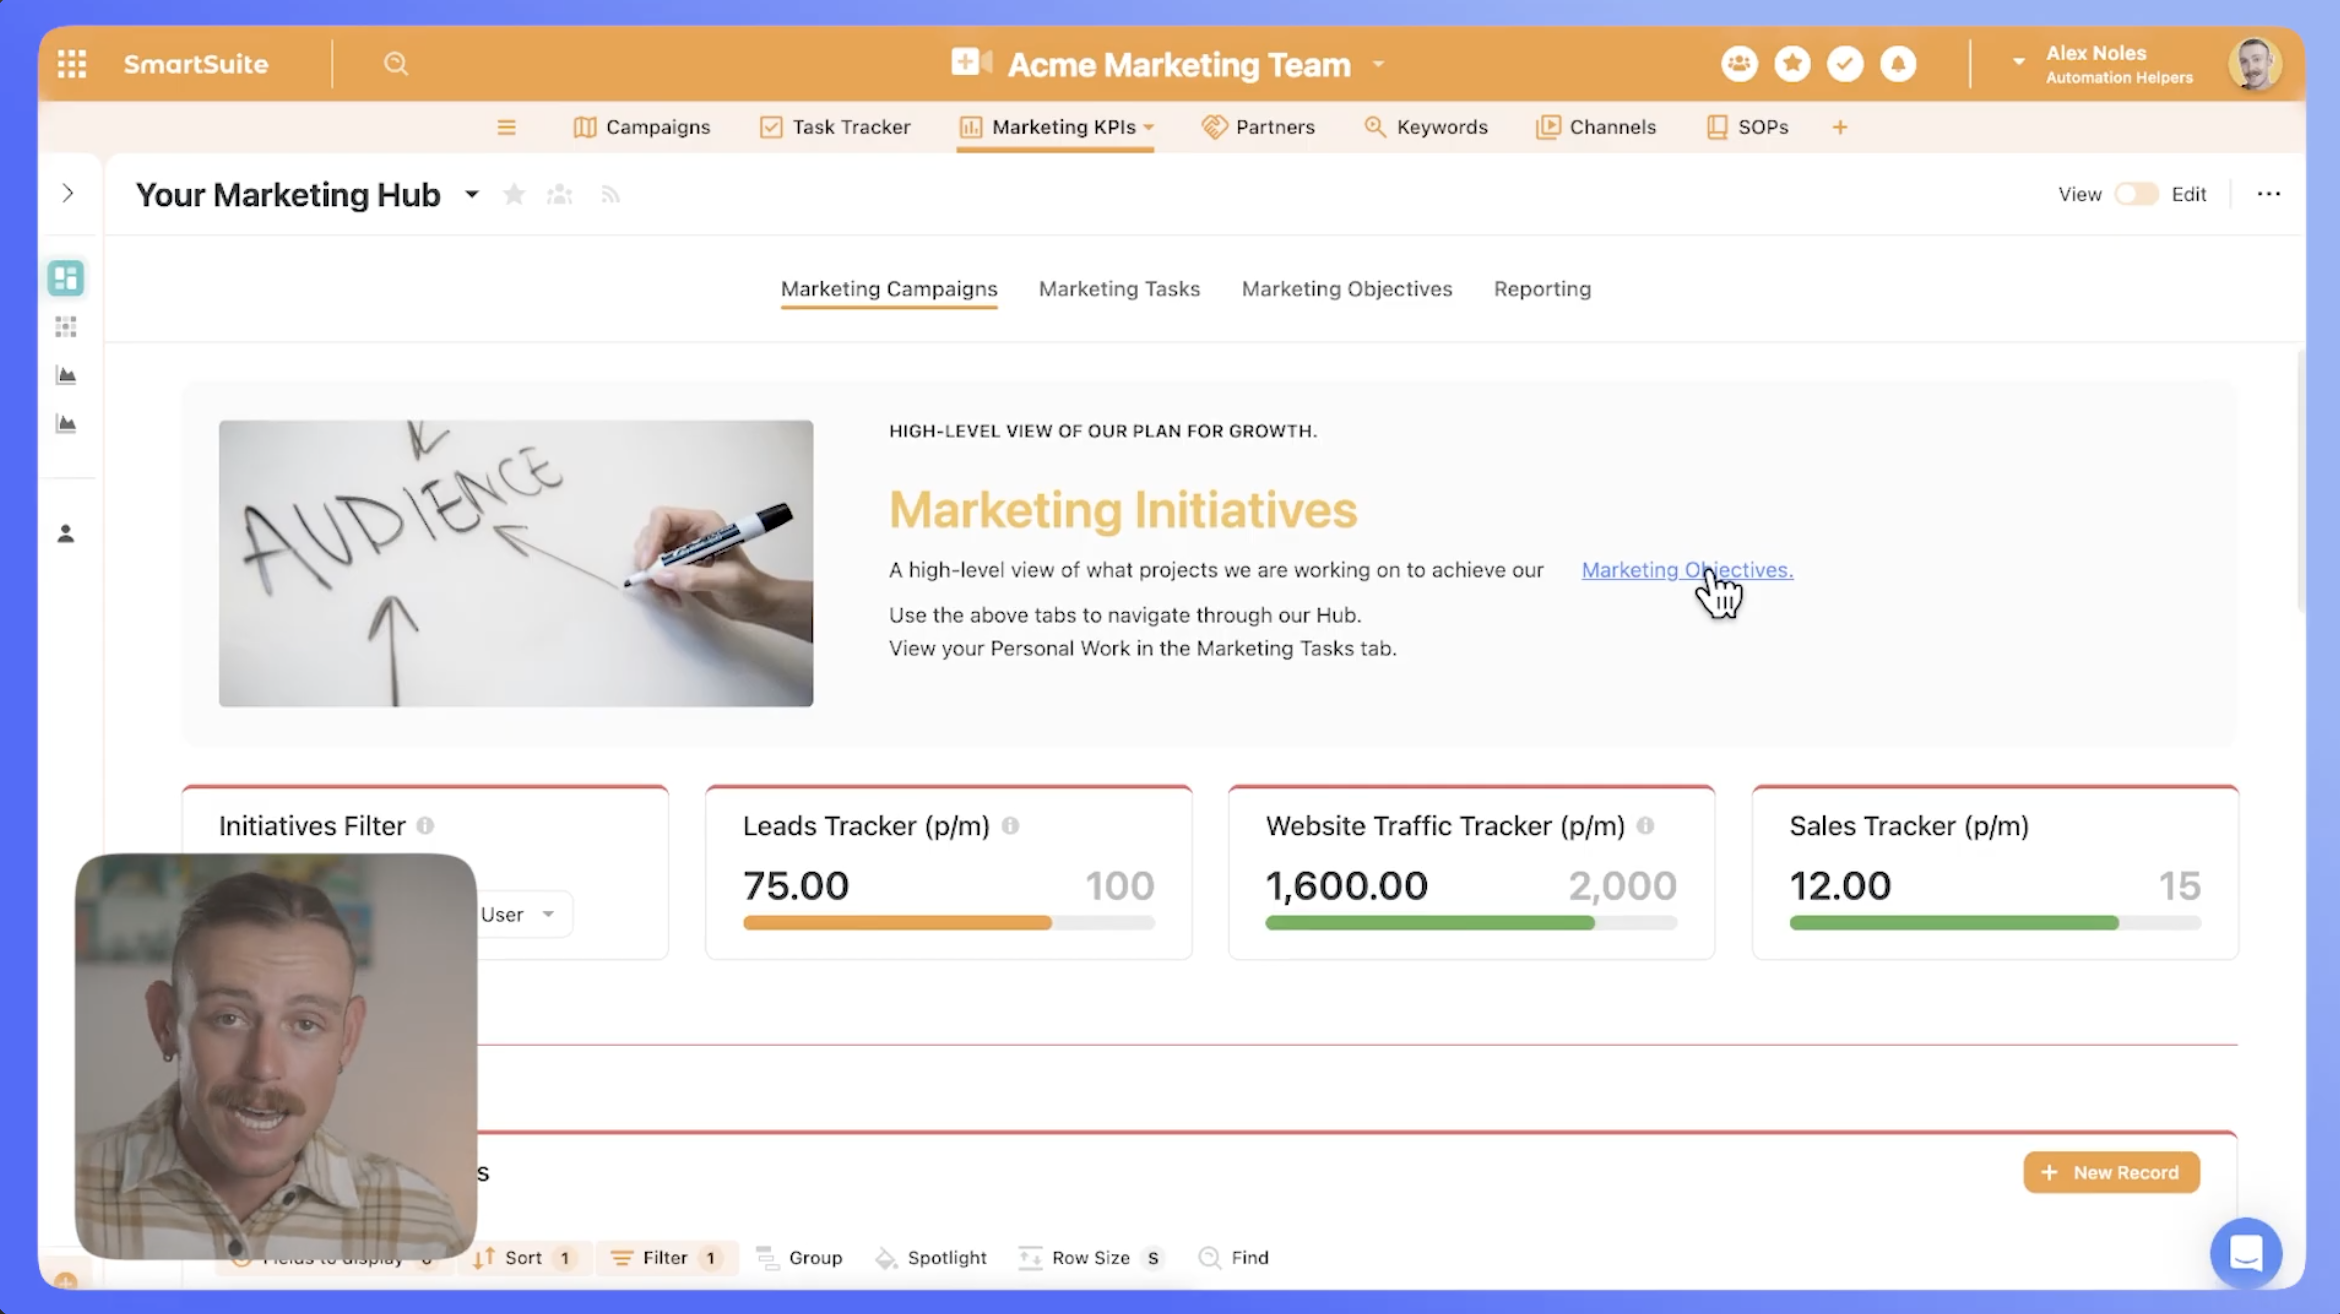
Inside the Marketing KPIs section, we’ve already created a dashboard.
The dashboard includes:
- Top navigation for Reports, Objectives, Tasks, and Campaigns
- KPI metrics such as our Lead Tracker, which uses orange to indicate items that need attention
- Website Traffic Tracker and Sales Tracker — currently showing 12 sales, with a goal of 15 for the quarter
We’ve also included:
- A list of Marketing Campaigns
- Widgets for active tasks
- A filtered view that only shows tasks assigned to the current user
Personalized Dashboard Widgets
This dashboard is where I complete my work.
I can see:
- My current campaigns
- My active tasks (e.g., "Write and publish blog post," "Update website")
- Any overdue items (none in this case )
How Do We Filter It?
We use a filter widget, set to show only tasks where the assignee is the current user. It gives me a clear, personalized view of what I need to focus on.
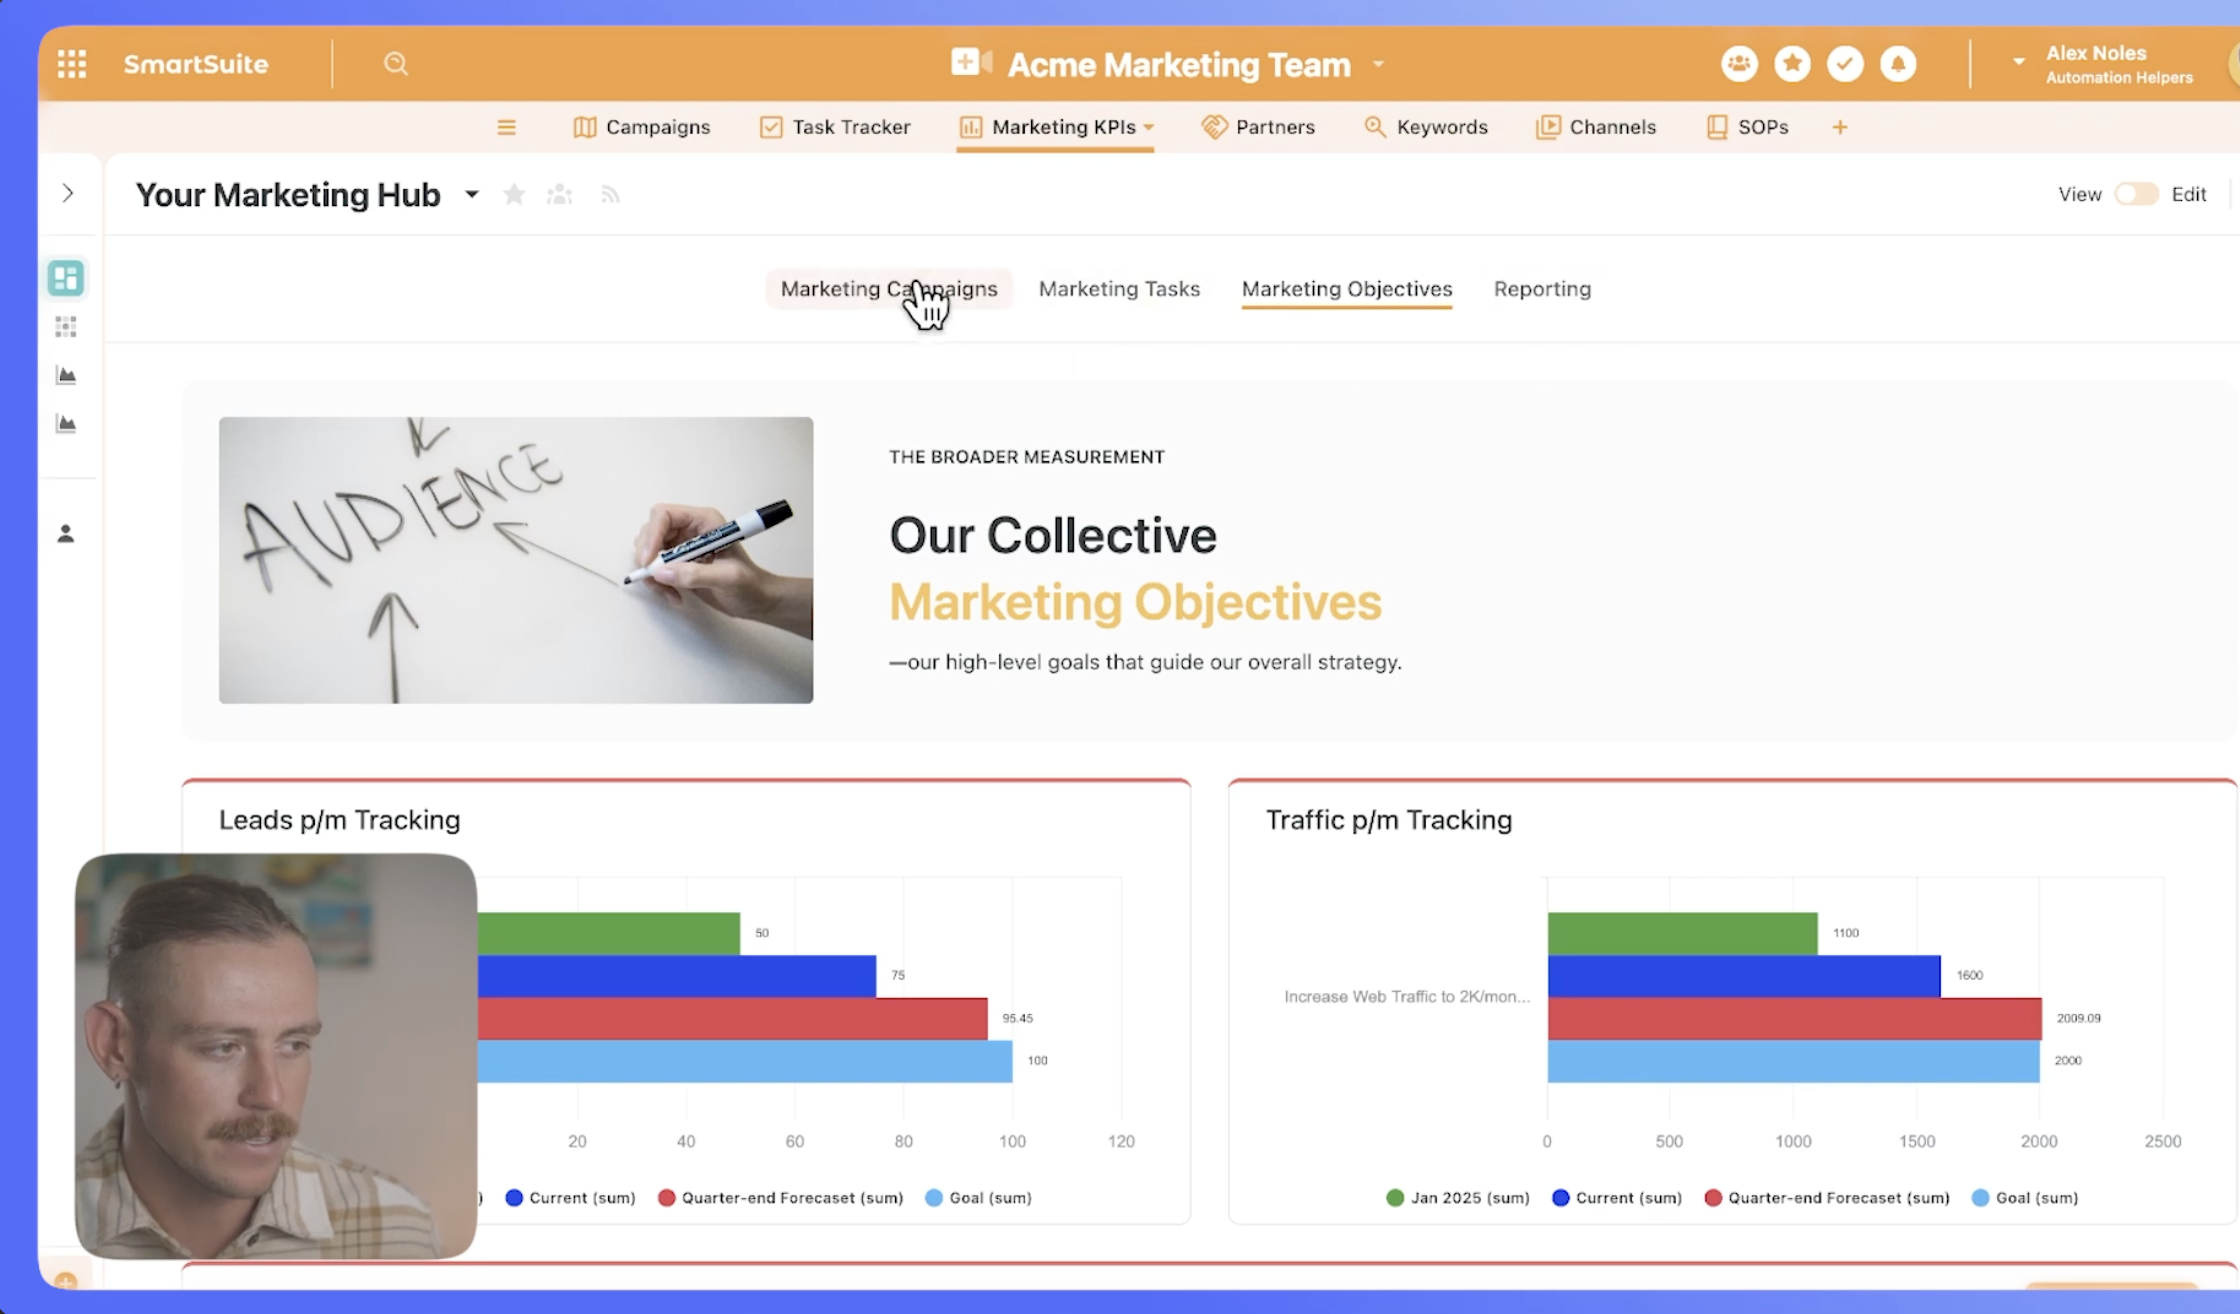
If I want to see objectives, I can. But we’ve also built visual chart views for:
- Lead goals
- Website traffic goals
For example, our traffic goal is 2,000 visits by quarter’s end. The forecast currently shows 2,009 (on track!). Right now, we’re at 1,600—starting from 1,100 earlier this year.
To set this up, we:
- Created a new view
- Selected "Chart" as the view type
- Chose our data values
- Added a Chart Widget to the dashboard
Why This Setup Works
With SmartSuite dashboards:
- Everyone sees how they’re doing—individually and as a team
- Team members know where they’re needed most
- Daily work aligns with bigger objectives
Sure, our team could just use a task tracker in grid, table, or Kanban views. But a dashboard gives so much more context. It turns the workspace into a mission control center.
We can even include resources to help team members get their work done faster and smarter.
Need Help Setting Up Your Workspace?
If you and your team need help setting up or automating your workflows, reach out to us at AutomationHelpers.com.
We’re offering a free 30-minute consultation, so book yours today!


.jpg)


