


Easily Order &
Group Items
Quickly drag and drop items to instantly order rows and apply groupings on the fly. We’re talking Olympic speed sorting and adjustments.
View projects and processes in a better than spreadsheet grid format with powerful sort, filter, group, and inline edit capabilities. Build what you want, from basic to extravagant.


Quickly drag and drop items to instantly order rows and apply groupings on the fly. We’re talking Olympic speed sorting and adjustments.

Quickly adjust columns in real-time. Reorder, resize, or freeze columns that are instantly saved for consistent viewing for your team.

Update data directly in the grid, no backend BS. Think spreadsheet, but smarter with pop-out task lists, tag values, files and images, and more. Best of all, it’s in real-time - so you’ll be able to see what your teammates are working on and avoid any duplicate work.

One click of the expand icon quickly opens the record to see all of the details, make quick adjustments, and then close to head back to your grid view.

Just drag and drop to add files and images to records directly in Grid View - you never have to leave the page.

Use our unique summary functions to display any kind of data in column footers - from status values to instant numeric calculations. It’s easy reporting without actually having to pull reports.

See open discussion threads for any record in a project or process. With one click, jump into the conversation and keep your workflow moving.

With our over 40 field types, you’re going to love adding new fields in Grid View. Just click the little plus button and add the genius stroke to your custom buildout.

Working with large datasets? No problem. Instantly (like search results in under a second) find specific data points.


Slice and dice your data all you want - it's yours after all.

Select just the right combination of fields to bring attention to important data. Customize to each project and process.
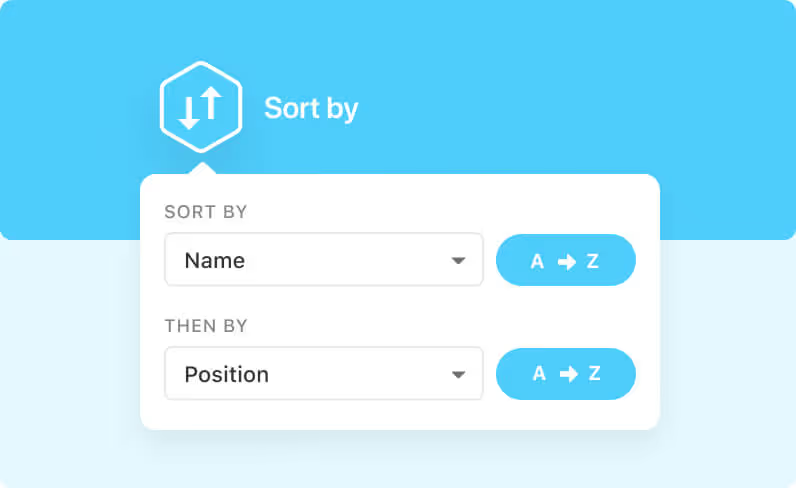
Sort your data in the way it makes sense for you, whether that's alphabetical, by a numeric value, by date, or something cool completely unique to you.
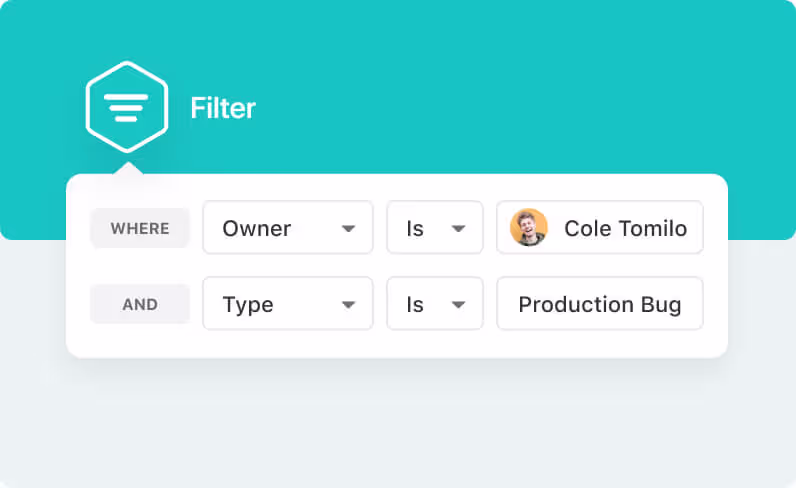
Filter your data by any other field, returning just the items you're looking for.

Group your data by the value of other fields, helping you organize and understand complex information easily.

Give special visual attention to important information by creating rules that match and highlight conditions or values you specify.

Change row size or let us do it automatically. No more calculating pixel sizes for your rows.

If you're looking for a particular bit of text in your records, you can quickly use the find filter to narrow things down.

Maximize your SmartSuite real-estate by flipping to full screen mode.
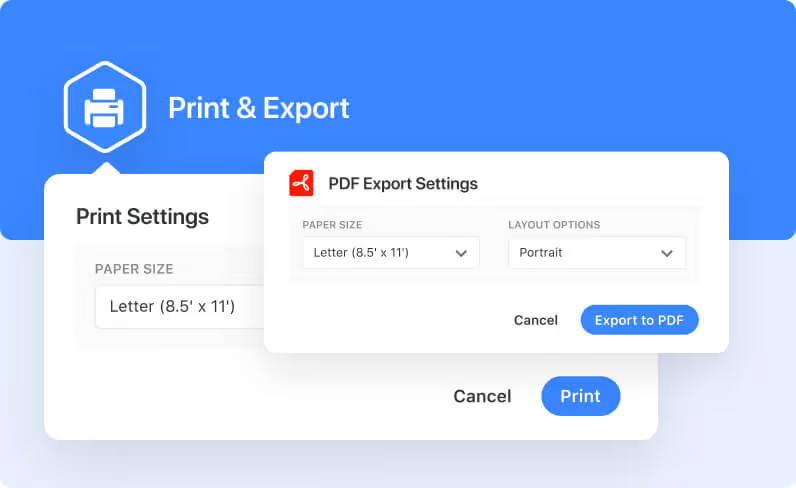
Print in a couple clicks, or export to PDF, CSV, Excel or Google Sheets.
SmartSuite's Grid View offers a versatile and enhanced spreadsheet-like format for managing projects and processes. With advanced sort, filter, group, and inline edit capabilities, it allows you to customize and manage your data efficiently, from simple layouts to complex setups.
Grid View enables rapid organization of items with drag-and-drop functionality for instant row ordering and on-the-fly grouping. This intuitive interface allows for what can be described as "Olympic speed" sorting and adjustments to your project data.
You have the flexibility to reorder, resize, or freeze columns directly in Grid View. These adjustments are saved in real-time, ensuring a consistent viewing experience for all team members.
Yes, Grid View allows for direct, real-time updates to data, similar to a spreadsheet but more intelligent. You can edit task lists, tags, files, images, and more within the grid, streamlining workflow and preventing duplicate efforts among team members.
Adding files and images to records is as simple as dragging and dropping them directly in Grid View, enabling efficient file management without needing to navigate away from the page.
Grid View includes unique summary functions that allow for the display of various data types in column footers, such as status values and numeric calculations. This feature facilitates easy reporting directly within the grid.
Open comment indicators provide quick access to ongoing discussions, enhancing communication flow. Additionally, Grid View supports the addition of over 40 field types, making it straightforward to tailor your data management and analysis needs with just a few clicks.


