


.jpg)
Welcome to another exciting tutorial with GAP Consulting! If you've been looking for a way to streamline your data management and create a cohesive view of your clients, orders, and line items all from one dashboard, you're in the right place. Today, we're diving into SmartSuite’s powerful new dashboards and how you can leverage them to bring all of your critical information together on one screen.
Introduction to SmartSuite Dashboards
SmartSuite's new dashboards are not only robust but also incredibly user-friendly. They offer the capability to link multiple datasets, providing seamless navigation through orders, line items, and other pertinent details all within a single unified interface.
Building the Dashboard: The Backend
Before diving into the dashboard, it's essential to understand how everything is connected in the backend. Let's explore our data schema and the tables involved.
Data Schema Overview
Inside SmartSuite, the solution we’re using is aptly named "Client Orders," and it includes four crucial tables:
- Clients
- Orders
- Line Items
- Inventory
Clients Table
Here’s a simple yet effective Clients table. This table contains basic information such as name, and connects to the Orders table, as orders are always made on behalf of a client.
Orders Table
The Orders table links to both the Clients table and the Line Items table. Each order might include one or multiple line items, and a formula is used here to calculate the order total by summing the line item totals.
Line Items Table
In this table, each entry links back to the corresponding order and the specific inventory items. It includes quantities and prices, with a formula calculating the total for each line item.
| Order ID | Inventory Item | Quantity | Unit Price | Line Item Total ||----------|----------------|----------|------------|-----------------|| 001 | Pine | 10 | $15 | $150 || 001 | Walnut | 5 | $30 | $150 || 001 | Spruce | 7 | $20 | $140 |
Inventory Table
This table is quite straightforward, listing different inventory items and their prices.
| Item | Price per Unit ||-----------|----------------|| Pine | $15 || Walnut | $30 || Spruce | $20 || Cedar | $25 |
With this schema in place, we’re ready to build our comprehensive dashboard.
Building the Frontend: The Dashboard
Our goal is to create a dashboard where users can select a client, view their orders, and drill down into the line item details. Let's start building.
Creating the Dashboard View
First, navigate to the Clients table and create a new dashboard view.
- Add New Dashboard View: Click on the left menu to add a new view and select "Dashboard."
- Customization Options: Dashboard configurations are flexible; you can add navigation, include logos, action buttons, footers, and tweak the style.
Adding Widgets
Client Selector Widget
- Record Picker Widget: Add a "Record Picker" widget to allow the selection of a client.
- Customize Display: Change the display settings to list view for a cleaner look. You can also add filters to display only active clients or show additional fields like address or phone number.
#### Client Selector Settings- **Source:** Clients Table- **Display Style:** List- **Background:** Neutral

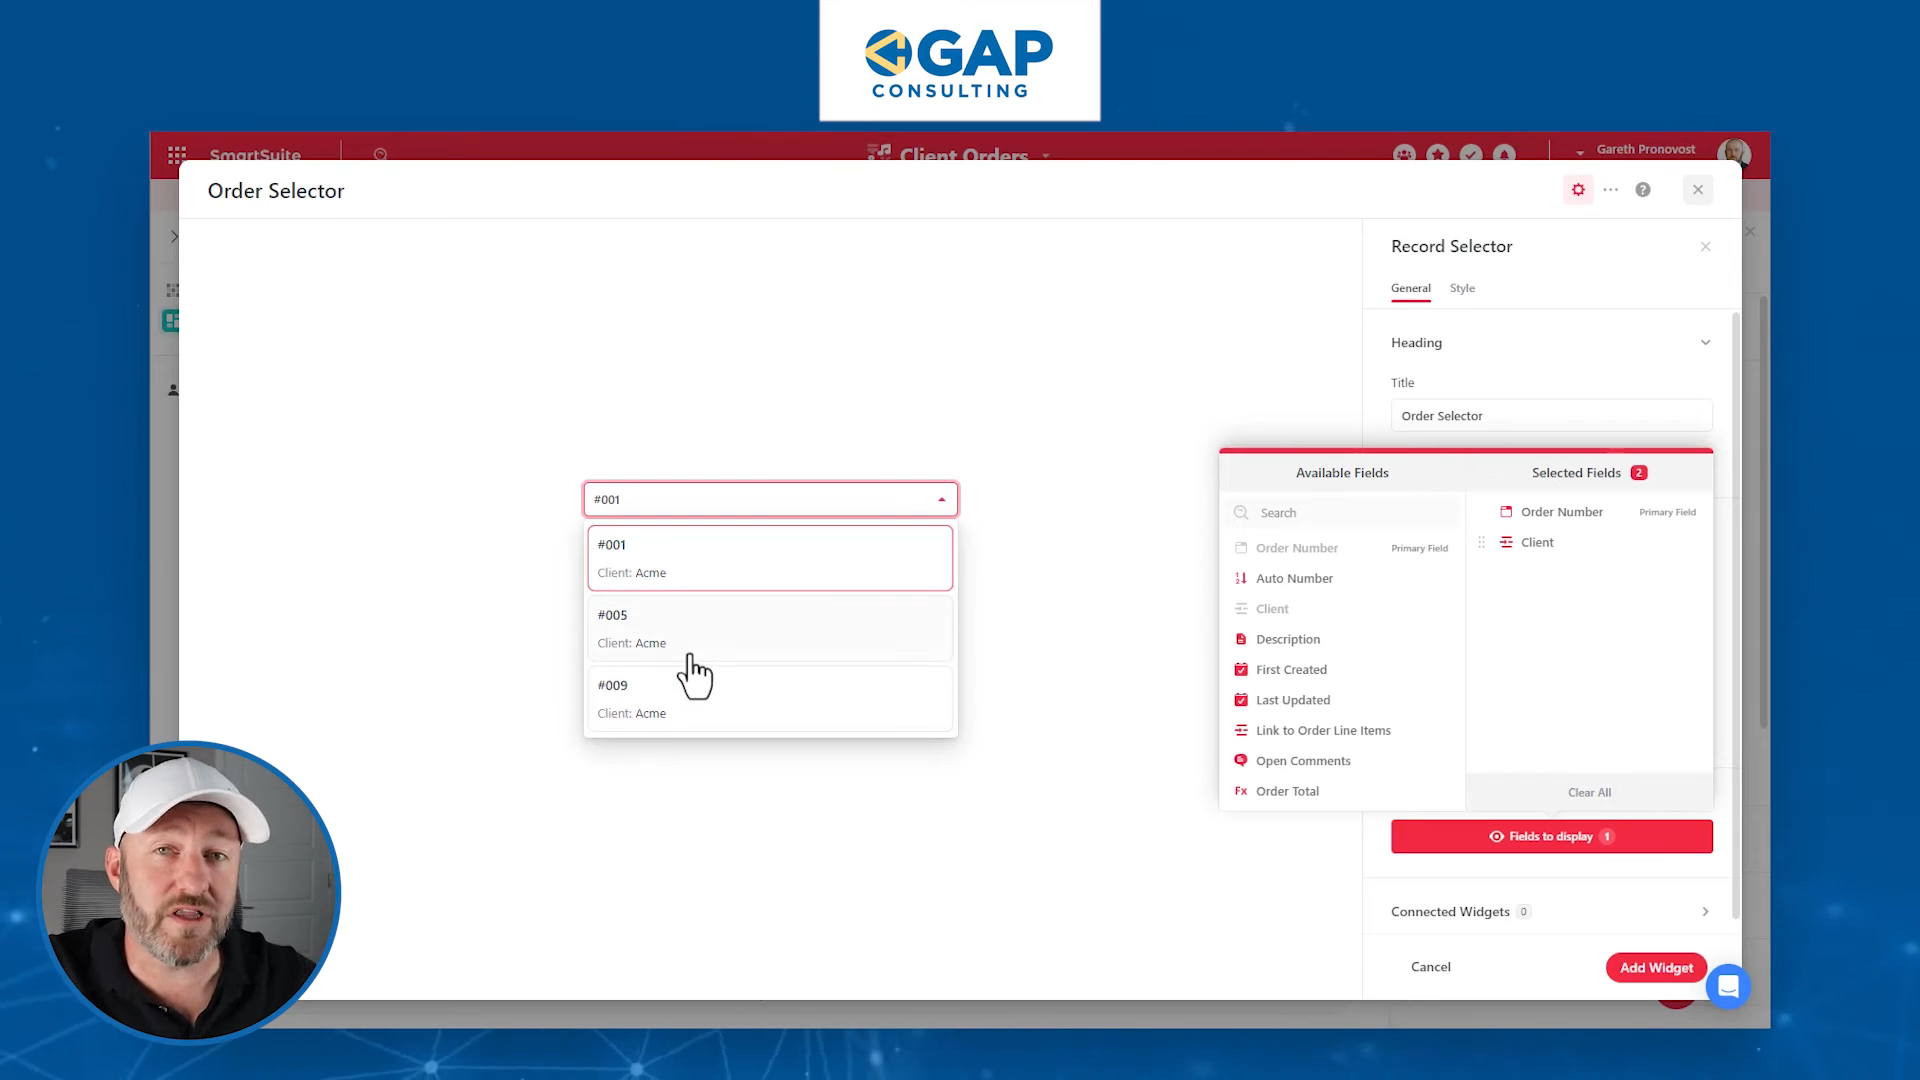
Order Selector Widget
- Linking Orders to Clients: Add another "Record Picker" widget. Set its data source to the client selector. This will filter the orders based on the selected client.
- Display Orders: Customize the fields shown, such as order number and client name for verification.
#### Order Selector Settings- **Source:** Client Selector Widget- **Field to Link:** Orders linked to the selected client- **Display Style:** List- **Background:** Neutral
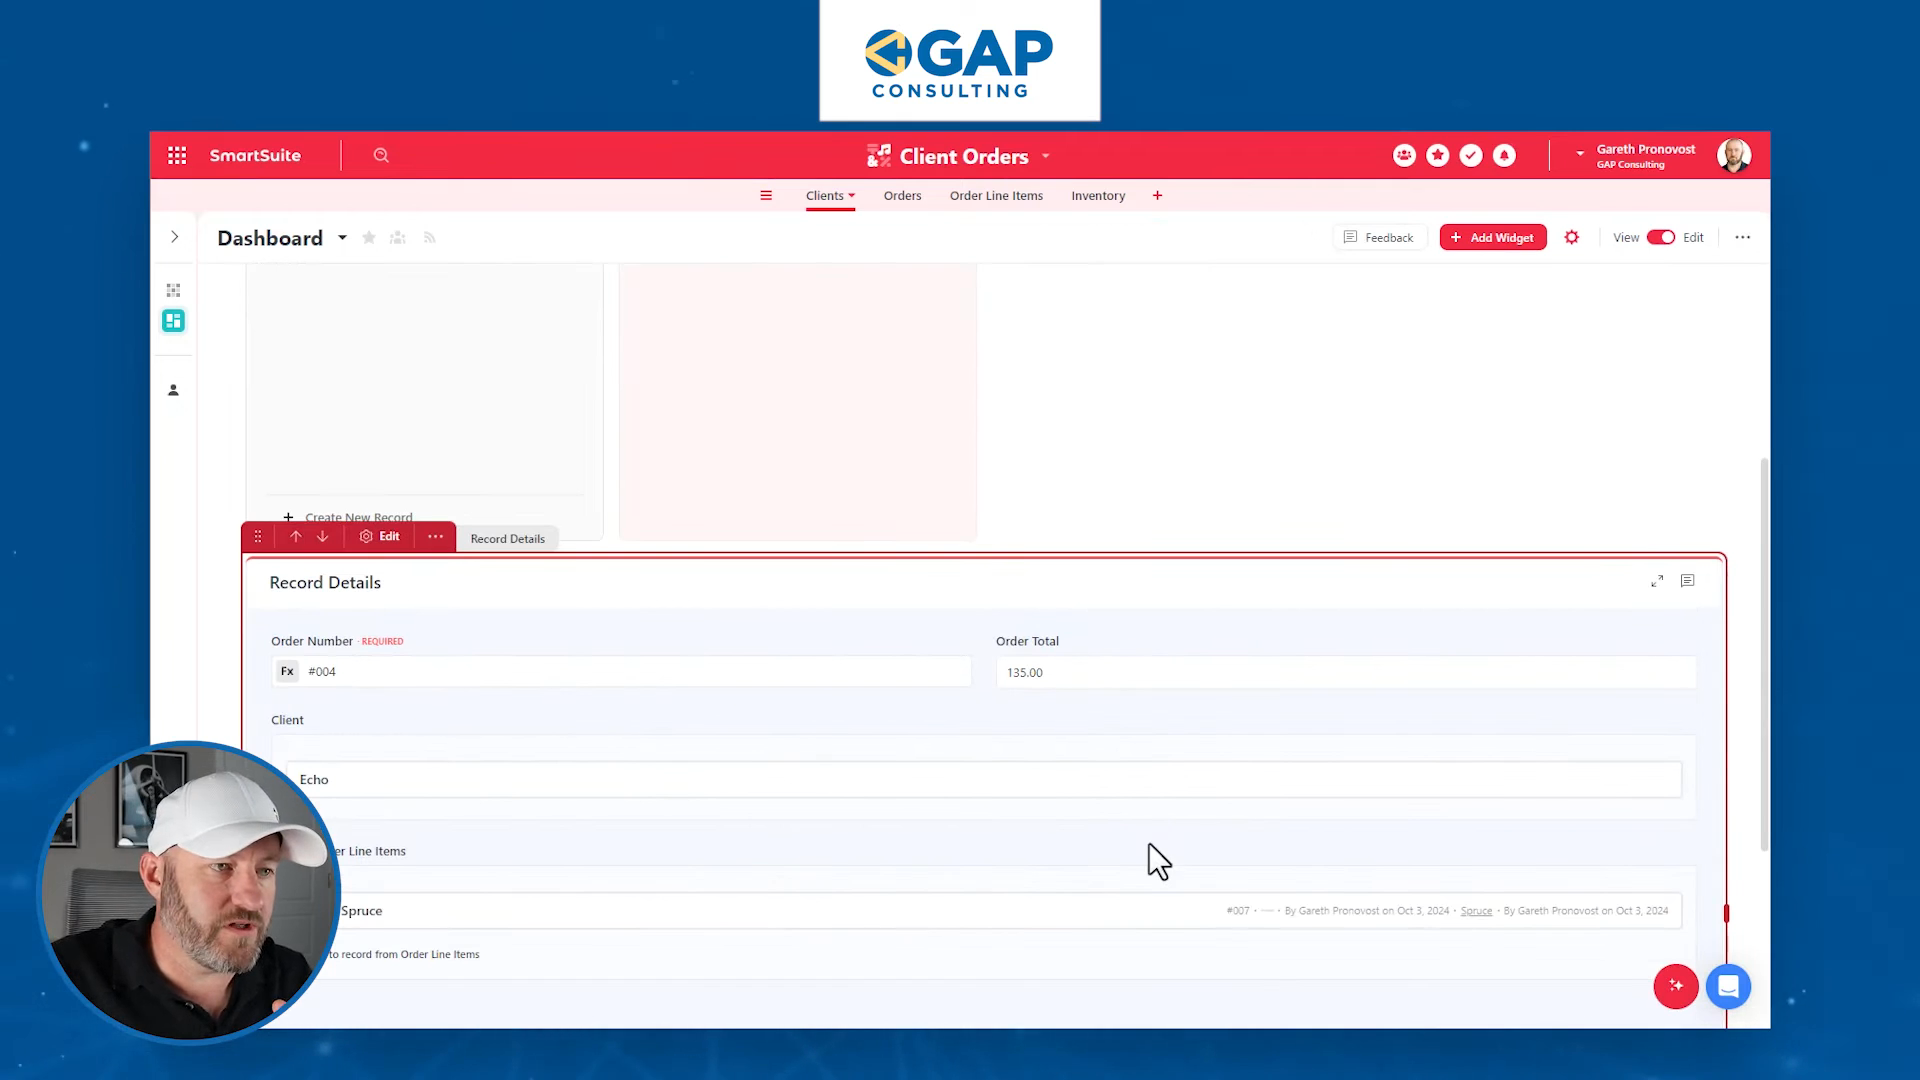
Line Item Details Widget
- Detailed View: Add a "Record Display" widget where the data source is the order selector. This widget will show detailed information about the orders including line items.
- Customization: Arrange fields to show critical information such as client name, order total, and the line items orderly.
Line Item Details Settings- **Source:** Order Selector Widget- **Fields to Display:**- Client- Order Number- Line Items- Order Total
Final Touches and Usability
SmartSuite dashboards are designed with user permissions in mind. Whether viewing or editing, user permissions will dictate the interaction level with the dashboard.
“The permissions in SmartSuite are top notch inside the no-code industry. They carry through even to these dashboards.”
Conclusion
SmartSuite’s new dashboards offer a powerful way to integrate various elements of your data into a single, interactive view. Whether managing clients, orders, or detailed line items, this system brings together all necessary information for efficient data handling.


