


Introducing the Dependency Field
This field type stores relations between tasks, and defines the scheduling rules to be applied in the Gantt View.
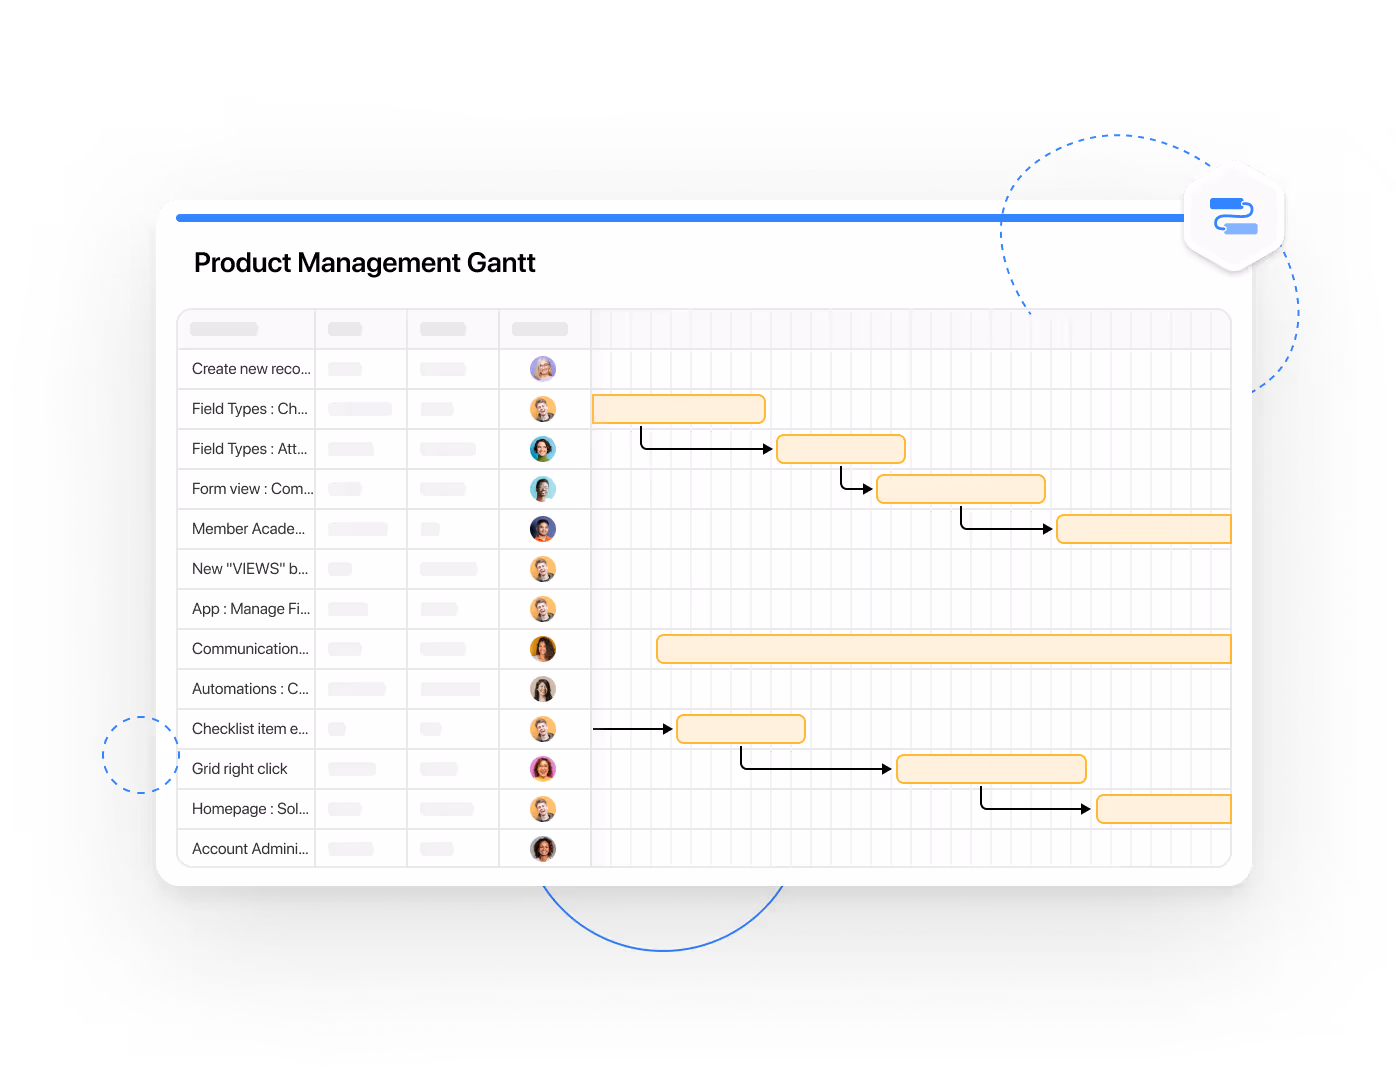
SmartSuite’s Gantt chart feature lets you oversee, adjust, and communicate project details, tasks, and timelines.

This field type stores relations between tasks, and defines the scheduling rules to be applied in the Gantt View.

Gain a 360 degree view of your project's timeline, milestones, and dependencies with our Gantt Chart feature. The visual representation simplifies complex project structures, making it easy to understand and manage.

Easily adjust project timelines with drag-and-drop simplicity. Our Gantt Chart empowers you to modify task durations, dependencies, and deadlines effortlessly. Ensure your project stays on track with real-time adjustments that reflect changing priorities.

Need to adjust your Gantt chart? Easily change dates and deadlines, drag and drop tasks, and reschedule tasks in bulk. When you reschedule a task with dependencies, all dependent active tasks are instantly rescheduled on the project timeline.

Allocate resources efficiently by visualizing team members' workloads and task assignments. The Gantt Chart feature helps you identify potential bottlenecks, balance workloads, and optimize resource allocation for a smoother project execution.

Enhance team collaboration with integrated communication tools within the Gantt Chart. Comment on tasks, share updates, and foster effective communication to ensure everyone is on the same page throughout the project lifecycle.

Unleash the power of our Gantt Chart's Spotlight feature to color code timeline pills based on dynamic display rules. Whether highlighting task priority, different project phases, or any other customizable criteria, this feature transforms your project visualization. Instantly recognize critical information and gain a nuanced understanding of your project's intricacies.

Customize your project perspective with our Gantt Chart's versatile timeframe options. Whether you prefer a detailed daily view, a comprehensive weekly overview, a strategic monthly plan, or a broader 3-month horizon, our feature adapts to your preferred time frame. Gain insights into your project's timeline with precision.

Customize your project perspective with our Gantt Chart's versatile timeframe options. Whether you prefer a detailed daily view, a comprehensive weekly overview, a strategic monthly plan, or a broader 3-month horizon, our feature adapts to your preferred time frame. Gain insights into your project's timeline with precision.

Advanced Mode lets you manage dependencies with a greater precision by setting a lag between tasks and applying one of the four dependency types.

Advanced Mode lets you manage dependencies with a greater precision by setting a lag between tasks and applying one of the four dependency types.
SmartSuite's Gantt Chart provides a visual representation of your project's schedule, allowing for the management of tasks, timelines, and dependencies. It enables precise control over project planning and execution by visualizing task relationships and critical milestones.
The Dependency Field helps you define relationships between tasks, setting up scheduling rules in the Gantt View. This feature ensures that changes in tasks or dependencies automatically update your project timeline, facilitating easier adjustments and planning.
Yes, with SmartSuite’s Gantt Chart, you can create milestones and dependencies, offering a comprehensive overview of your project's timeline. This makes it simpler to manage complex projects by clearly identifying key deliverables and their dependencies.
The Gantt Chart allows for easy adjustments of project timelines, task durations, and deadlines with drag-and-drop functionality. It supports bulk rescheduling of tasks, including those with dependencies, ensuring your project adapts to changing priorities seamlessly.
By visualizing team workloads and task assignments, the Gantt Chart helps identify bottlenecks, balance workloads, and optimize resource allocation. This ensures efficient use of resources and smoother project execution.
The Gantt Chart is customizable to fit your project management style, offering dynamic color coding with Spotlight for easy visualization and various timeframe options for detailed to broad project views. You can also use Group by, Filter, and Sort features to organize data effectively.
The Gantt Chart feature is available to all paid SmartSuite plans, including Team, Professional, Enterprise, and Signature. This ensures that organizations with a subscription can leverage this powerful tool for comprehensive project management and scheduling.


